
Geophysics
How Agile Software Empowers Better Surface Decisions
How Agile Software Empowers Better Surface Decisions As geological research becomes increasingly complex, the tools used to collect, analyze, and…

Seisware is now a part of Computer Modelling Group Ltd.

We can’t always see the rocks we need to map and if there is one thing we can be certain about, it’s that rock properties can and do change. Rocks can vary wildly over short distances, or their changes can be more gradual, spanning much larger scales. To understand these changes and scales, we rely on measurements from instruments or from samples taken at discrete points in space.
Contouring is a common way to visualize spatial data on maps to make it easier to understand subsurface structures and variations in geological and geophysical properties across a given area.
By drawing lines (contours) that connect points of equal value, contouring allows geoscientists to interpret trends, patterns, and anomalies in complex data—whether it represents elevation, pressure, temperature, or porosity. Contouring simplifies complex datasets, translating thousands of measurements into a format that makes spatial patterns clear and useful for geoscience exploration and development work.
The most common types of contour maps that SeisWare encounters in projects are topographic contours, isopach maps, and isochron maps.
There are three approaches to contouring.
Manual Contouring – Sharpen your pencils! Some geoscientists still prefer to contour data by hand. It’s a great way to get started as you learn the basics of contouring. As the number of data points that you’re working with increases, a manual approach can become quite complicated and time-consuming.
Computer-assisted contouring – Some software programs contour data automatically based on algorithms. While computer-assisted contouring is fast and can be used with large datasets, the results do depend on the algorithm being used.
Gridding and interpolation – Most modern contouring relies on gridding (creating a network of data points) and interpolation, where values are estimated for points in between known data locations. Interpolation techniques like kriging or inverse distance weighting ensure smoother, more accurate contours by producing smoother grid to contour.
Often these approaches work best when used together.
Sometimes the best approach isn’t a single method, but a combination of them. For example, computer-assisted contouring may get you 75% there, but the results require manual editing. This is a common approach with SeisWare users. They will manually edit the computer-generated contours and have SeisWare’s applications automatically re-grid and re-contour to adjust for these changes.
Another approach is to see gridded data on-the-fly while picking tops. By seeing the Basemap update automatically, geoscientists can quickly identify outliers, edit them, and see their edits reflected on the Basemap.
When contouring data, knowing the scale, data resolution, and underlying geology can help achieve a successful result.
Firstly, select an appropriate contour interval. Too large an interval may miss critical details, while too small may create visual noise. Understanding the resolution of your data can help guide you. High-resolution (closely spaced) data allow for finer contours, while lower-resolution data require a broader brush to avoid creating misleading patterns.
Lastly, sometimes gridding and interpolation algorithms can introduce strange patterns that aren’t geologically appropriate to the setting. Keeping the underlying geology in mind can help to identify artifacts or patterns that aren’t in the data.
As technology advances, it is important to keep the basics in mind. Contouring is an indispensable tool in geoscience for reducing complexity and driving special understanding and supporting decision making.
Curious about any of the features mentioned in this article? Reach out to our support team to ask how you can implement these workflows.
Share this post
How Agile Software Empowers Better Surface Decisions As geological research becomes increasingly complex, the tools used to collect, analyze, and…
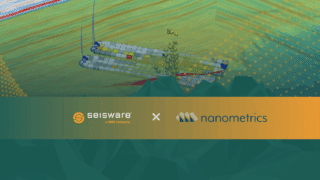
Calgary, AB – May 7, 2026 — SeisWare is excited to announce a new integration with Nanometrics that brings high-fidelity…

Why Geoscience-Engineering Misalignment Costs Millions In the oil and gas industry, true integration between geoscience and engineering has been recognized…
Our free monthly newsletter gives you access to our most valuable tools, resources, and insights without the unnecessary extras.

"*" indicates required fields

"*" indicates required fields
"*" indicates required fields
"*" indicates required fields